
Operational Insights from London’s Bike Sharing Data
Github | Tableau
Background :
As cities increasingly focus on sustainable urban transportation, it’s essential to grasp the factors that shape public bike-sharing systems. This project delves into how environmental elements like weather, humidity, and wind, along with temporal aspects such as the season, time of day, weekdays versus weekends, and holidays, influence bike usage patterns in London.
The goal is to provide valuable insights that can inform inform business decisions regarding maintenance schedules, demand-based pricing, and promotional strategies.
Business Use Cases / Applications :
- Time-specific promotions (“Weekend Ride Discount” or “Summer Pass Offers”)
- Workforce planning, Maintenance & redistribution
- Urban planning, Better station placement
- Demand-Based Pricing (pricing strategies based on time, weather, and holiday patterns)
- Identify periods of low usage (perform maintenance with minimal disruption to users)
Dataset
- Over 17,000+ Entries
- 11 Features : date, time, Count of bike shares, real temp, temperature feels like, humidity, wind_speed, weather_code, is_holiday, is_weekend, season
Tech Stack Used :
Python (Pandas, Numpy, Matplotlib, Seaborn), Tableau, Jupyter Notebook
🔍 Data Cleaning & Processing Steps Github
- Initial Inspection
- Loaded data with Pandas
- Displayed data types, head, tail, and summary stats
- Datetime Handling
- Converted
timestamptodatetime - Created
year,month,day, andweekdaycolumns
- Converted
- Missing Values
- Checked and verified presence/absence of
NaNs
- Checked and verified presence/absence of
- Data Type Conversion
- Ensured proper types for numerical and categorical columns
- Outlier Detection view data cleaning procedure.
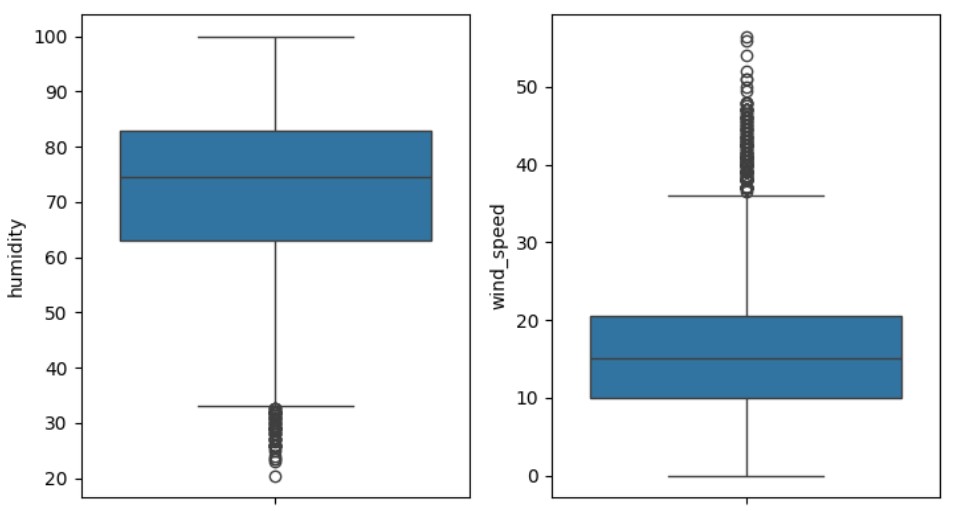
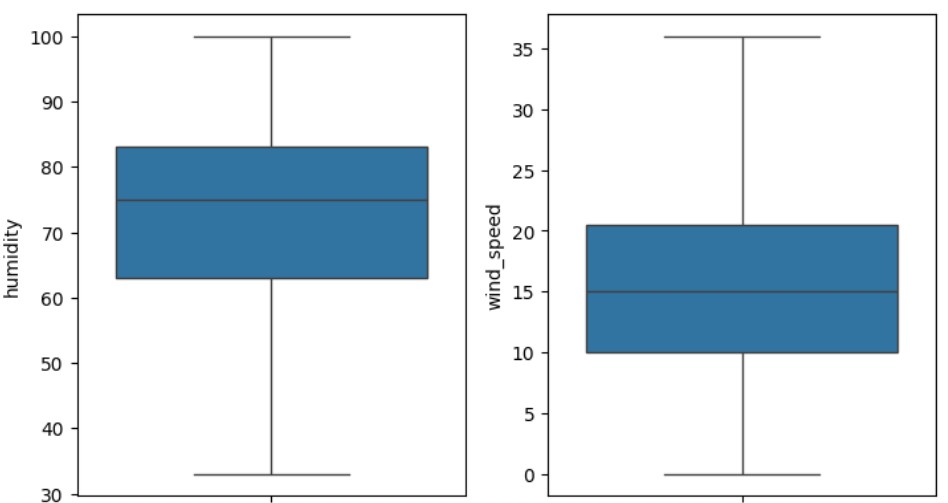
- Used boxplots and statistical thresholds, IQR (Interquartile Range) to identify outliers
- EDA (Exploratory Data Analysis)
- Visualized trends over time
- Plotted correlations between temperature, humidity, and bike usage.
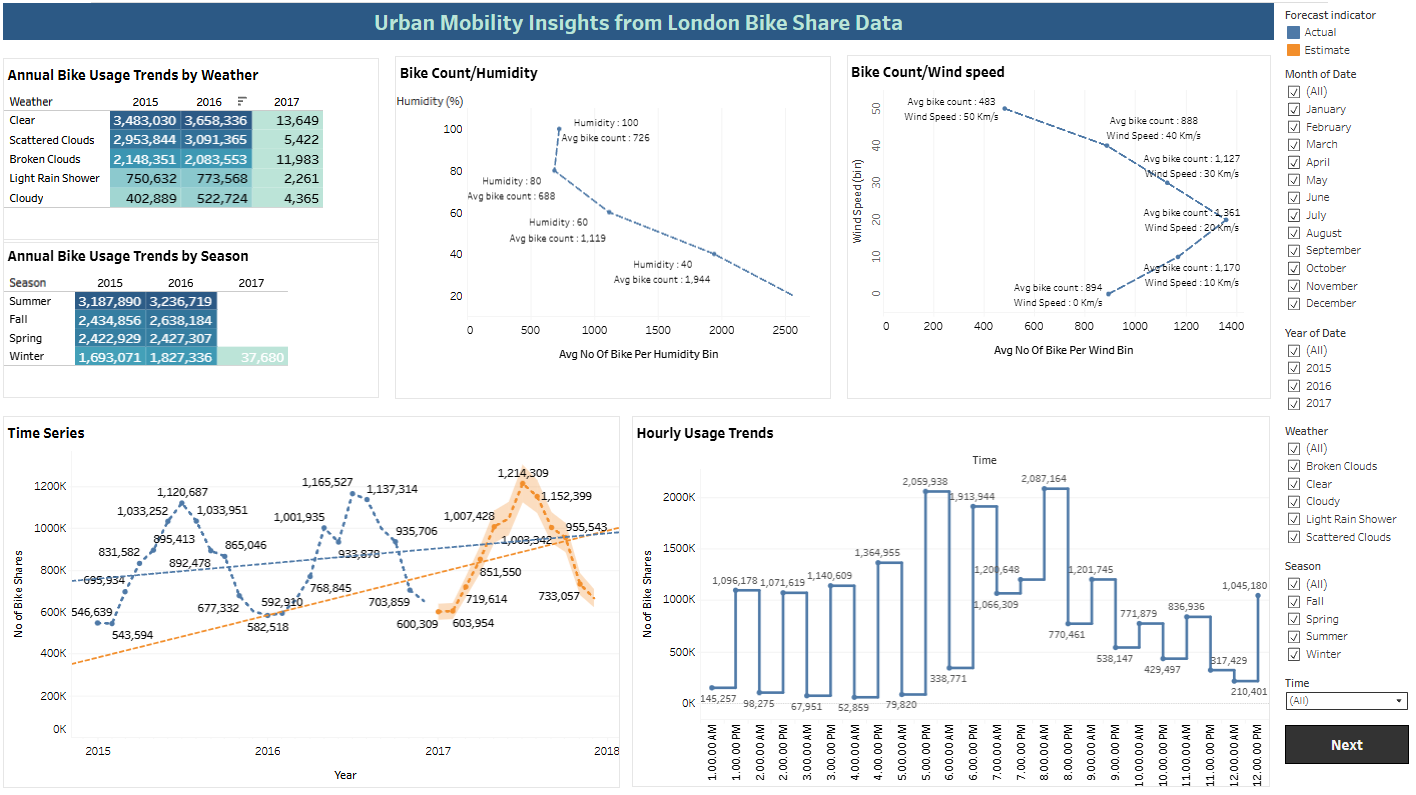
Data Visualization and outcome Tableau
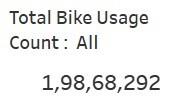
- Grand total of all bike shares: 19,868,292
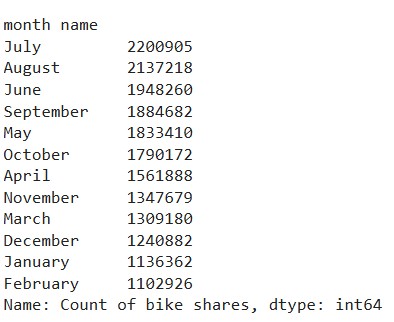
- Total bike shares per month, aggregated over all years.
- 💡 Helps answer business questions like: “In which months should we increase bike availability or maintenance workforce ?”
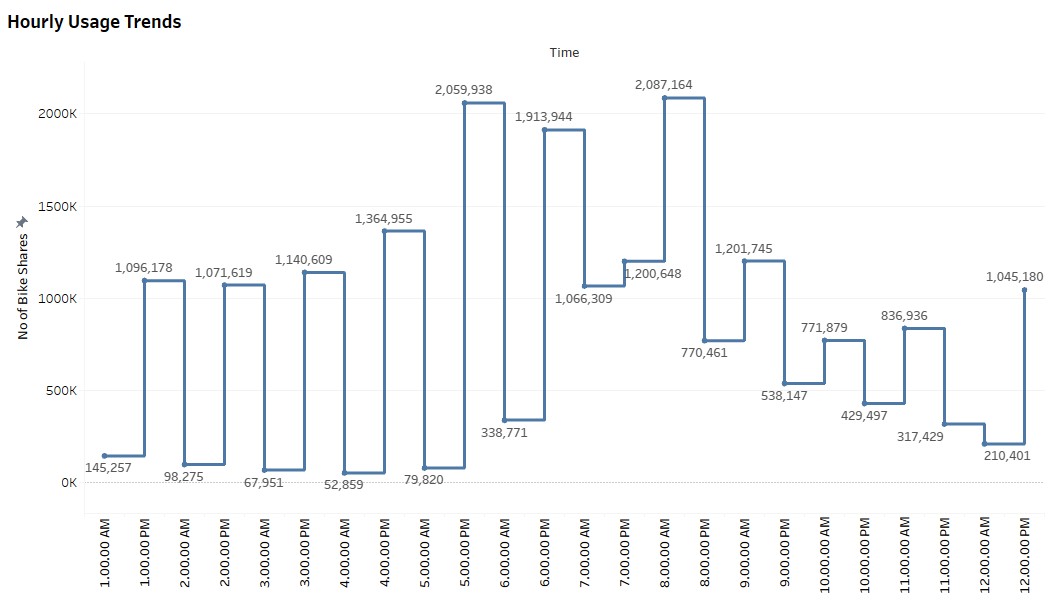
Morning Peak (7–8 AM):
- 🚴 1.6M–2M shares.
- 💡 Ensure max bike availability for commuters.
Evening Peak (5–6 PM):
- 🚴 1.9M–2M shares.
- 💡 Rebalance fleet ahead of evening rush, ensure max bike availability for commuters.
Lunch Time Steady Demand (1–3 PM):
- 🚴 ~1M shares.
- 💡 Maintain moderate supply during mid-day hours.
Early Morning Lows (1–4 AM):
- 🚴 ~100K shares.
- 💡 Schedule maintenance during low-traffic periods, to minimize the service disruption.
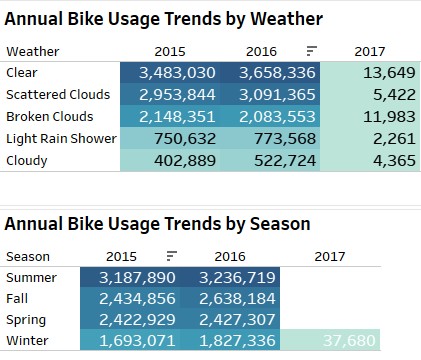
Clear Weather = High Demand:
- 🌤 Highest usage in both 2015 & 2016.
- 💡 Boost fleet and promotions on clear days.
Low Usage in Rain/Clouds:
- 🌧 Lowest in Light Rain & Cloudy.
- 💡 Run campaigns to boost ridership in mild bad weather.
Year-on-Year Growth (2015→2016):
- ☁ Cloudy: +30% (from 402K to 523K).
- 💡 Monitor & support growing demand in less favorable weather.
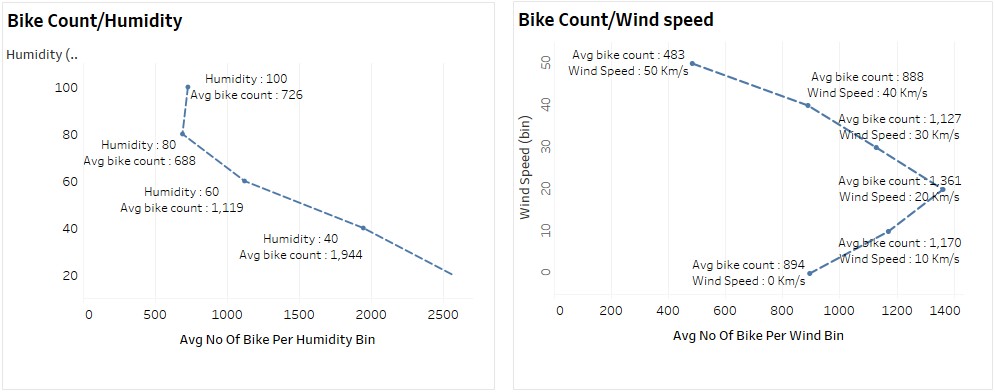
High Humidity = Low Usage:
- 💧 40% → Avg. 1,944 rides
- 💧 100% → Avg. 726 rides (Bike usage drops by ~62.6%)
- 💡 Send alerts/discounts to boost ridership on humid days.
Strong Winds Reduce Usage:
- 🌬 20 km/h → Avg. 1,361 rides
- 🌬 50 km/h → Avg. 483 rides (Bike usage drops by approximately 64.5%)
- 💡 Integrate wind condition tips into rider app notifications, can avoide accidents or any tragedy.
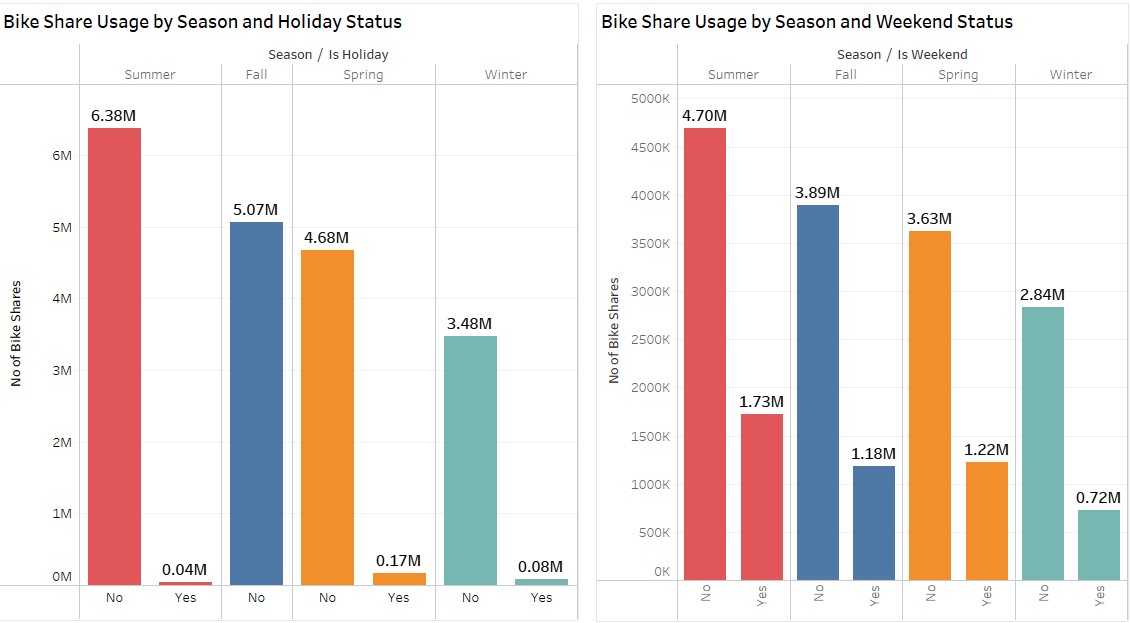
Weekday = Peak Usage (Commute-Focused):
- 📅 Highest rides occur on weekdays (work/school commutes)
- 💡 Maintain high bike availability during weekdays.
Lower Usage on Holidays/Weekends:
- 📉 Notable drop in non-working days
- 💡 Launch holiday-specific promotions to boost leisure ridership.
Conclusion :
- Key operational insight suggests, clearly that bike usage is heavily influenced by temporal and environmental factors - with peak activity during weekday commute hours and under clear weather conditions.
- Commuting Behavior: Consistent peaks at 7–9 AM and 5–6 PM reaffirm the role in work-related travel, fortifying the need for optimal bike availability during these windows.
- Low-usage periods (1–4 AM) present ideal windows for maintenance with minimal disruption.
- Launch targeted promotions for weekends & holidays to boost leisure usage.
- Can implement demand based pricing and rebalancing course of action tied to time-of-day and weather forecasts.