
Toy Products & Store Analytics – Toy Retail Sector
Github | Power BI
Background:
A toy business operating across multiple stores in Mexico and offering a variety of toy products is looking to gain a clearer picture of its product sales, profitability, and inventory usage across all store locations.
This project analyzes performance across multiple stores, product categories, and time periods, to uncover key insights.
Business Use Cases / Applications:
To understand:
- Sales and profit trends across different products and stores
- Inventory inefficiencies (e.g: high stock but low sales)
- Products with high profit margins but low sales volume
- Best-performing product categories by store and over time
- Ideas for optimizing pricing based on performance trends
Dataset:
Tech Stack Used:
Python (Pandas, Numpy, Matplotlib, Seaborn), Power BI, Jupyter Notebook
🔍 Data Cleaning & Processing Steps:
- Imported the dataset using Pandas
- Used
.info(),.describe(), and.isnull().sum()to understand the structure, data types, and missing values - Detected some outliers in the data (through visualization) — but chose to retain them as they might reflect real-world business cases or exceptional events
- Handled nulls and type mismatches, particularly in Date columns
- Corrected the Date column’s datatype for proper time-based analysis
Insights:
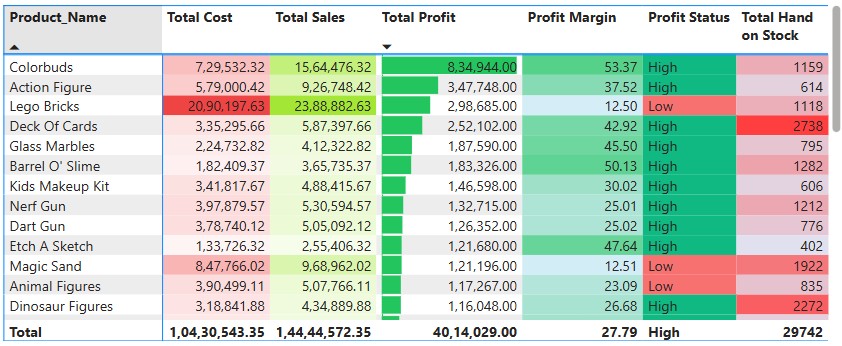
- Products with Profit Margin > 25% are marked as “High” Profit Status, else “Low”
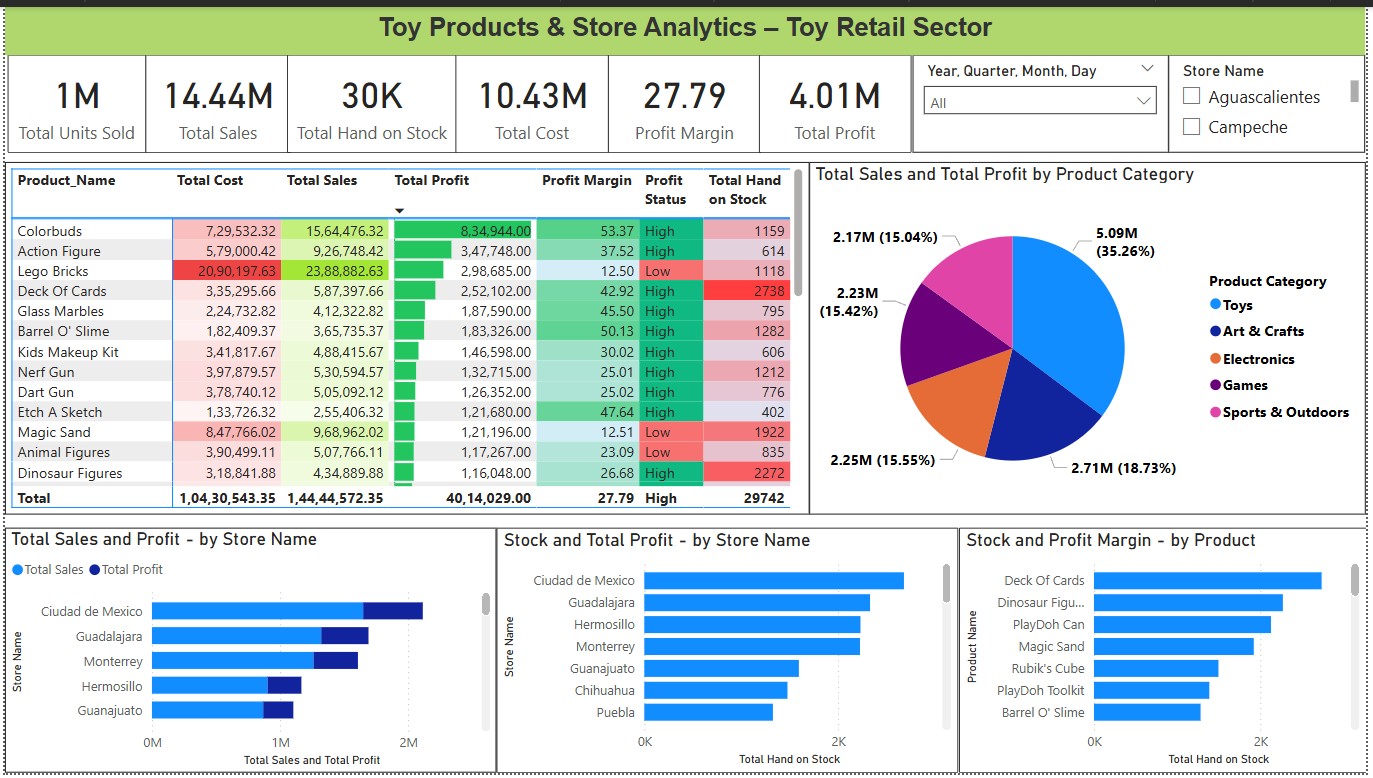
- Lego Bricks, Magic Sand, Animal figure need attention — they have high costs but low returns
- Colorbuds and Action Figure show excellent performance — high profit and high margin.
- 💡 Helps identify which products are cost-effective and which ones are draining profit and adjust the stock level accordingly.
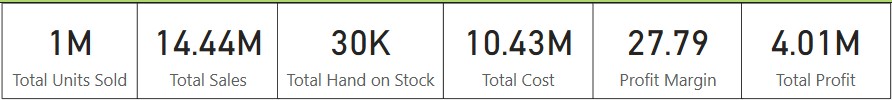
- $1M Units Sold
- $14.44M in Sales
- 30K Units in Stock
- $10.43M in Total Cost
- 27.79% Profit Margin
- $4.01M in Profit
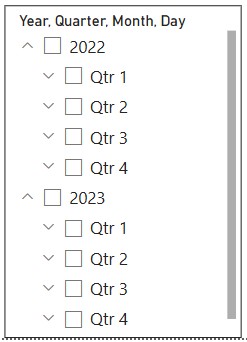
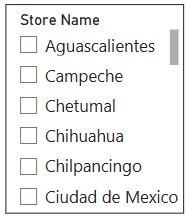
- 💡 Added 2 slicers to filter by date (year/quarter) and store name.
- We can identify overstocked low-margin items like Lego for key decisions
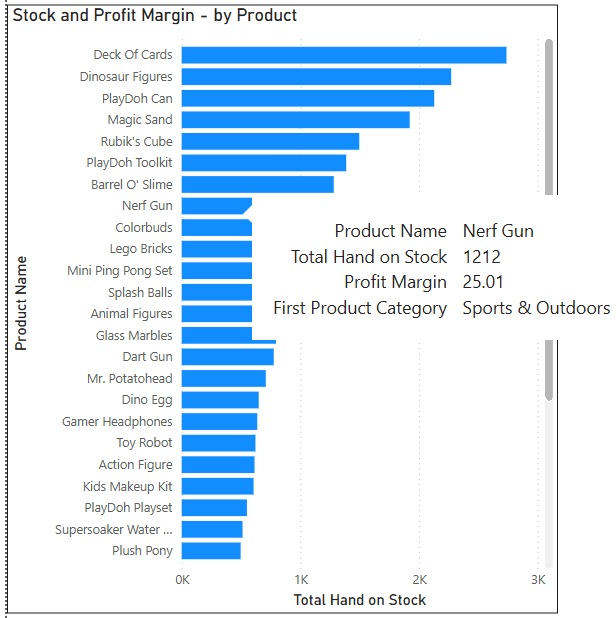
- 💡 Visual compares stock levels vs profit margin for each product.
- Hover tooltip shows key details: product name, stock, margin, and category.
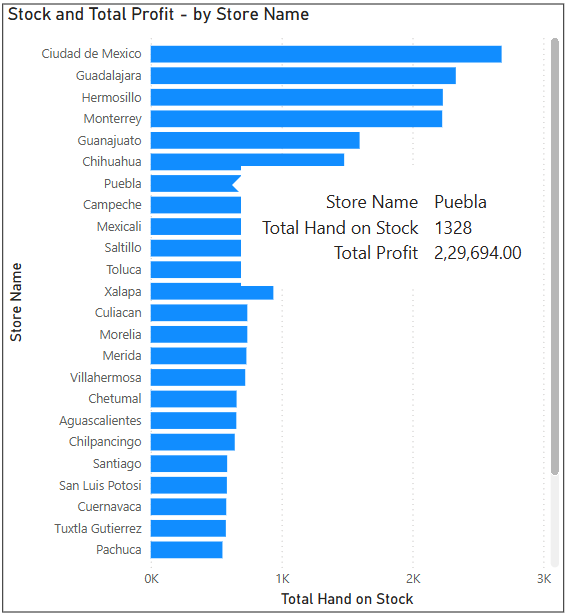
- 💡 Visual shows stock vs profit per store.
- Helps spot high-stock but low-profit stores for potential inventory redistribution.
- Tooltip gives store name, stock on hand, and profit —e.g., Puebla has 1,328 units in stock and $2.29L profit.
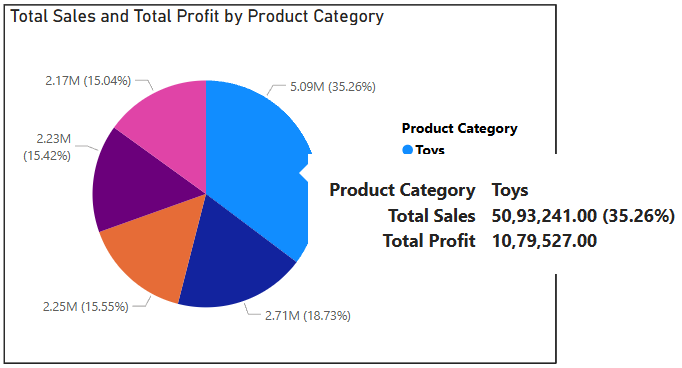
- The chart breaks down total sales by product category, showing each category’s contribution to the whole.
- Toys account for 35% of sales, with a profit of $1 million.
- The lowest is Sports & Outdoors, contributing 15.04% of sales with a profit of $500K.
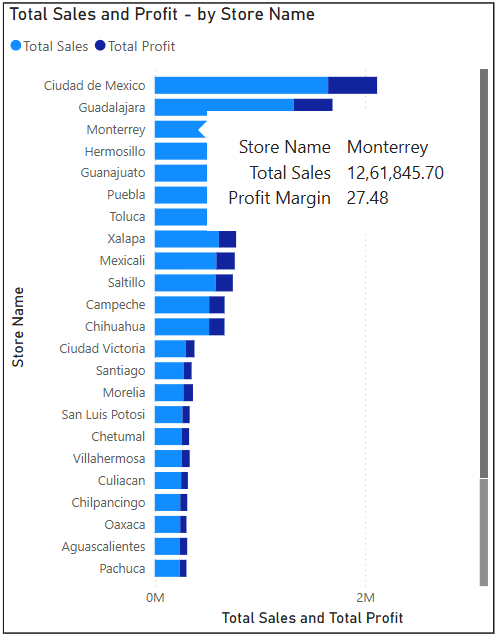
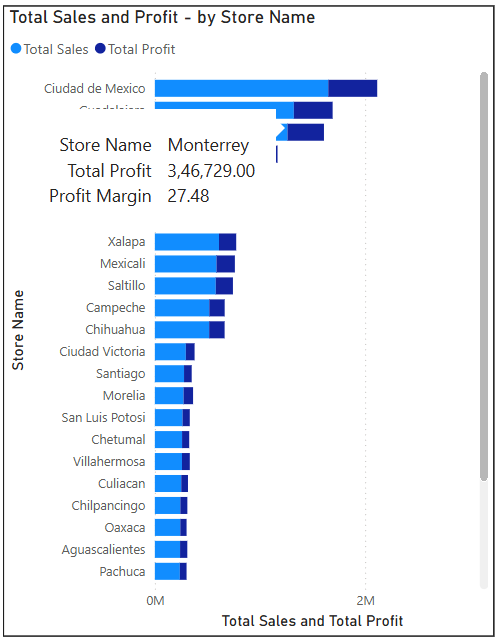
- Ciudad de Mexico, Hermosillo, Mexicali leads in absolute sales and profit. Monterrey shows high with a strong profit margin of more than 27.48%.
- Guadalajara shows high sales but a proportionally lower profit margin.
- Locations like Pachuca, Oaxaca, Chetumal, Aguascalientes are identified as low-volume contributors, requiring strategic review.
Conclusion (with Numerical Insights):
- Total sales reached $14.44M from 1M units sold, but 30K units remain in stock, with several being low-margin items — especially Lego, requiring redistribution to reduce holding costs.
- The overall profit margin stands at 27.79%, indicating a healthy average
- Products like Lego Bricks, Magic Sand, and Animal Figures showed high stock levels but low returns, contributing to over $10.43M in total cost while offering low margins (<25%)
- Toys lead with 35% of $14.44M sales and $1M profit, while Sports & Outdoors lag with 15.04% sales and $500K profitrmance
- Monterrey shows a strong profit margin of over 27.48% along with - Ciudad de Mexico, Guadalajara.
- Cities like Chetumal, Villahermosa, Culiacan, Chilpancingo, Oaxaca, Aguascalientes, Pachuca show low sales and profit, needing review
- Review pricing and cost strategies in Guadalajara and Sports & Outdoors (only $500K profit from 15.04% sales share) to enhance profitability.