
Credit Card Data : Exploratory Data Analysis using Python
Github
Background:
This project undertakes a comprehensive Exploratory Data Analysis (EDA) of a credit card dataset, delving into customer demographics and transaction behavior. The core objective is to reveal crucial patterns, relationships, and trends in card usage and financial metrics, ultimately delivering actionable insights for strategic product development, targeted marketing campaigns, and enhanced customer retention.
Dataset Overview:
- Source: Public dataset from Kaggle
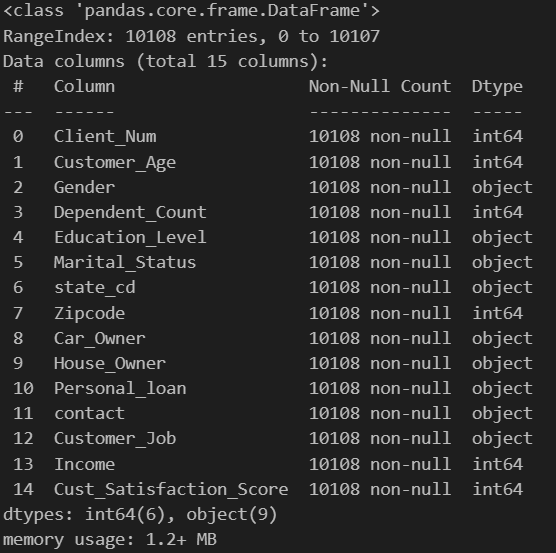
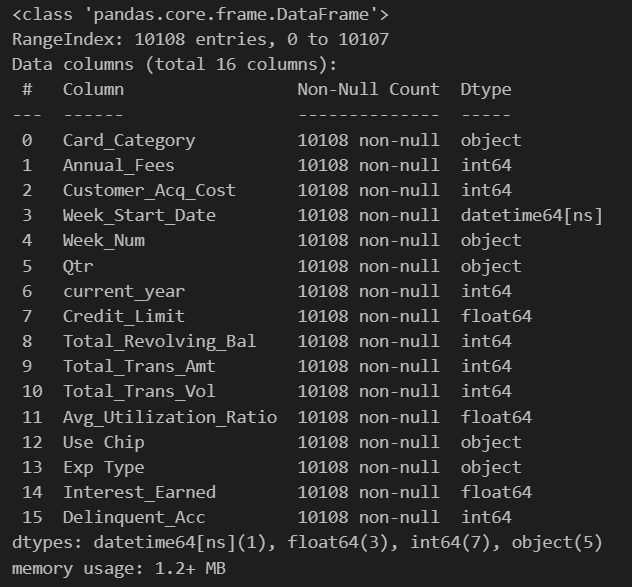
- Nature: Tabular customer-level credit data and customer dataset
- Records: Includes features like demographic information, credit behavior, and financial indicators
Tools & Technologies Used:
- Language: Python
- Libraries: pandas, matplotlib, seaborn, numpy
Insights from Credit Card Dataset:
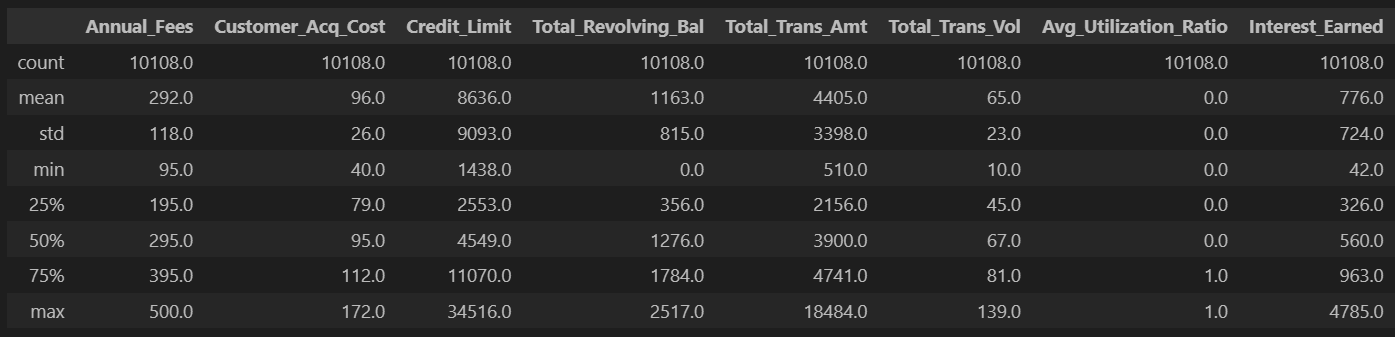
-Table provides key descriptive statistics (count, mean, std, min, 25%, 50%, 75%, max) for eight numerical credit card metrics across 10,108 entries.
Extreme values (outliers) were kept because they likely reflect legitimate, unique customer segments (e.g., high spenders, premium cardholders) within the credit card data, providing valuable information
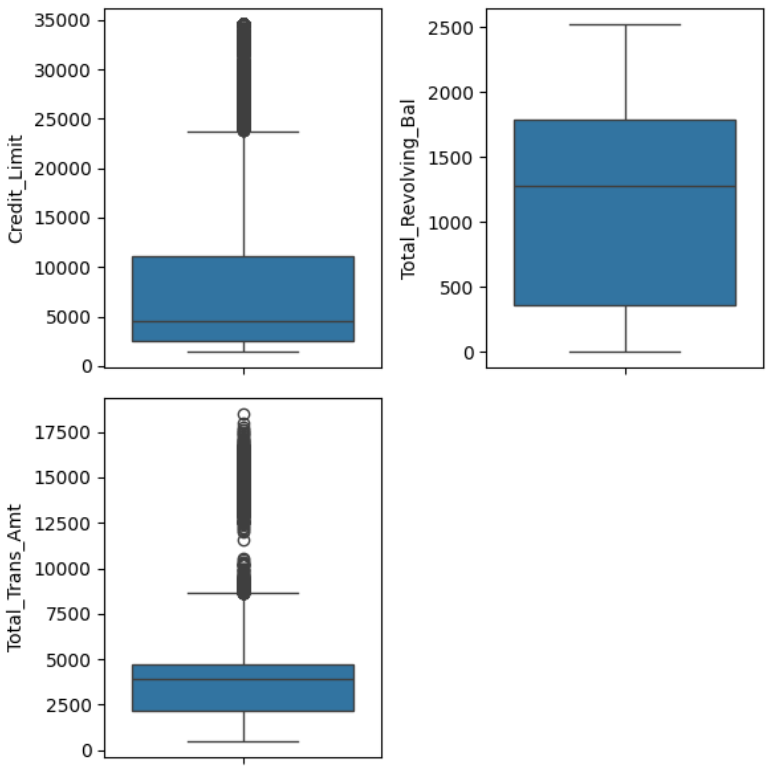
- Credit_Limit: Median ~$5k-$6k, IQR ~$2.5k-$11k. Outliers extend to $35k, representing high-tier credit access.
- Total_Revolving_Bal: Median ~$1.2k-$1.3k, IQR ~$400-$1.8k. Very few high outliers, indicating consistent revolving balances.
- Total_Trans_Amt: Median ~$3.5k-$4k, IQR ~$2k-$5k. Outliers reach $18k-$19k, showing a segment of high-spending customers.
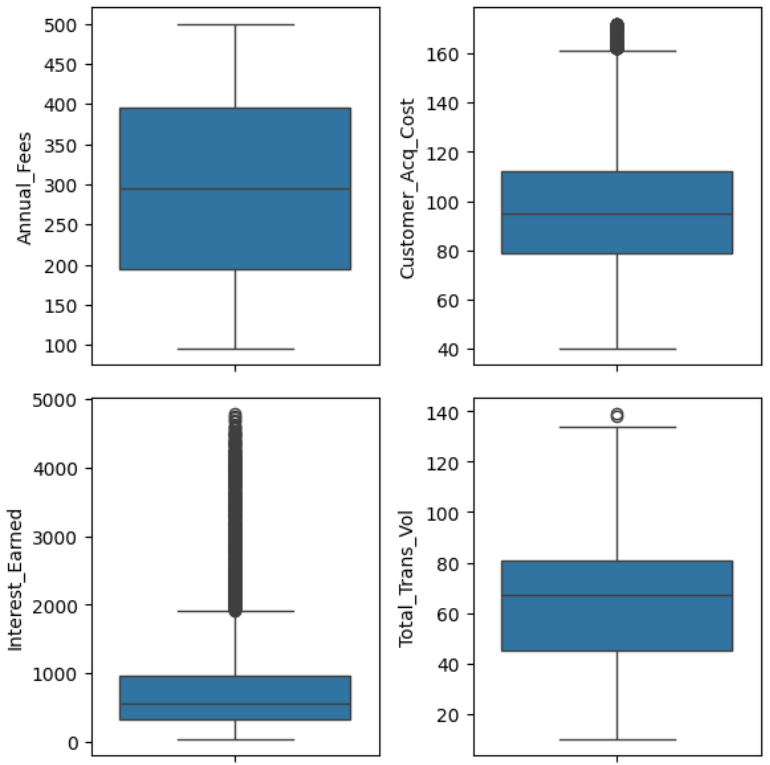
- Annual_Fees: Median ~$300, IQR ~$200-$400. Outliers extend to $500, showing a range of fee structures.
- Customer_Acq_Cost: Median ~$95-$100, IQR ~$80-$115. Outliers reach ~$170, indicating some higher acquisition costs.
- Interest_Earned: Median ~$500, IQR ~$200-$1000. Many outliers extend up to ~$4800, showing a segment with significantly higher interest earned.
- Total_Trans_Vol: Median ~65, IQR ~45-80. Outliers reach ~140, suggesting some customers have much higher transaction frequencies
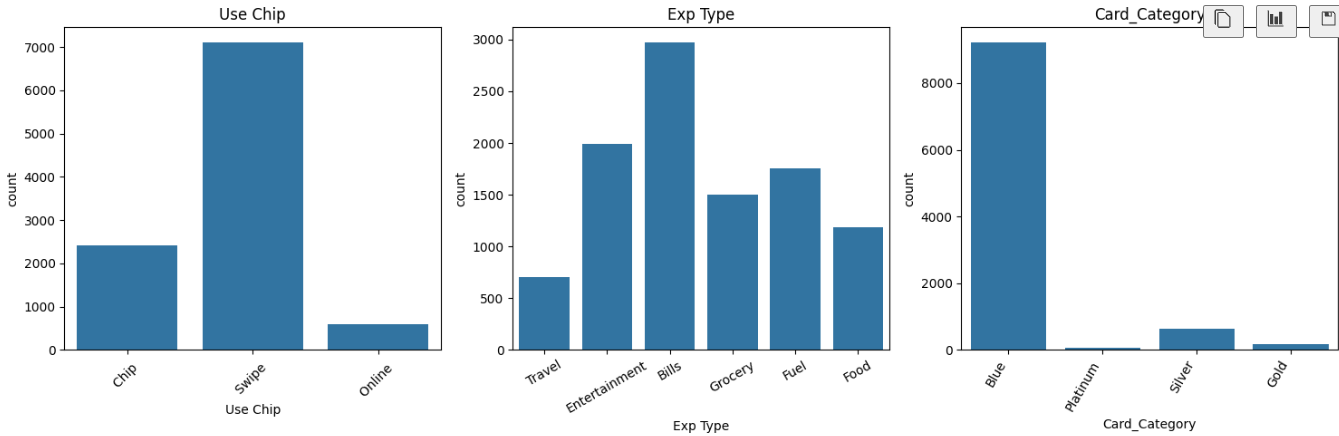
- “Swipe” method is by far the most common transaction type, approximately 7,000 transactions
- Blue: Overwhelming majority, ~9,000 cards. Gold: Very rare, <50 cards.
- Bills: Most frequent, ~3,000 occurrences. Entertainment & Fuel: Significant, ~2,000 and ~1,700 transactions
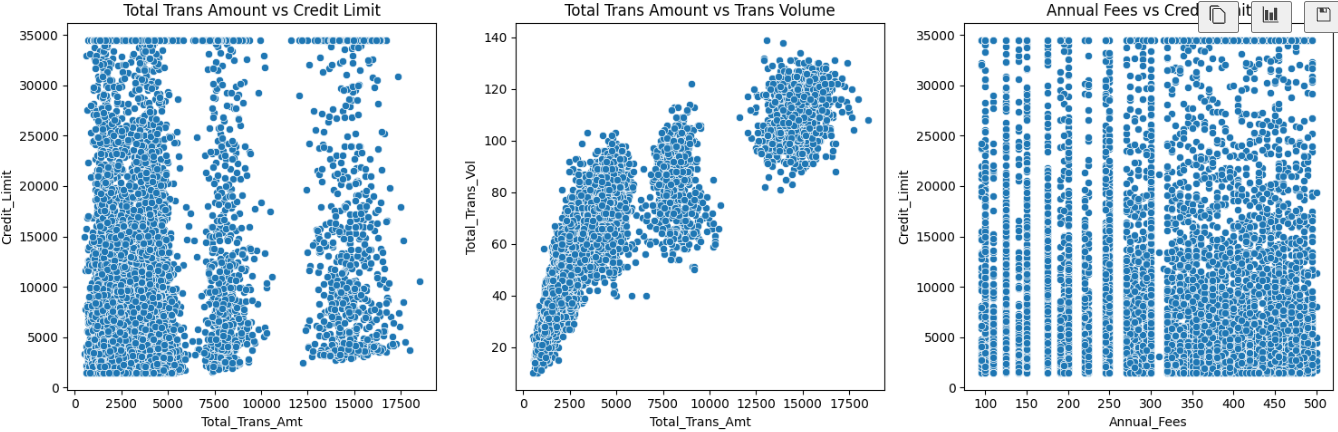
- Total Trans Amount vs Credit Limit : No strong linear correlation; transaction amounts are spread across limits.
- Total Trans Amount vs Total Trans Volume: As Total_Trans_Amount increases, Total_Trans_Vol increases proportionally, showing some clustered steps.
- Annual Fees vs Credit Limit: No clear linear correlation; high credit limits can have low fees, and vice-versa.
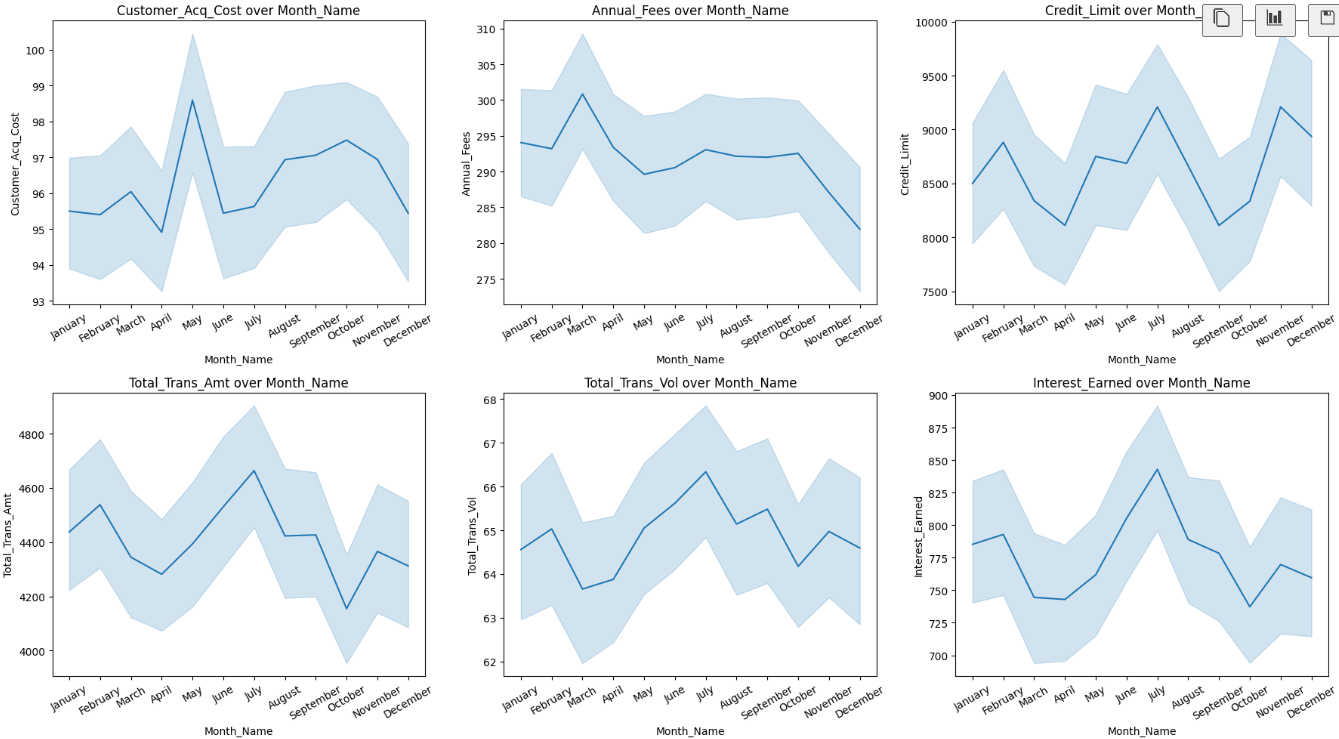
- Customer_Acq_Cost: Peaks April-May (~100), lowest March/late year (~95), showing seasonality.
- Annual_Fees: Highs in March-April (~305-310), lows in early/late year (~280-285).
- Credit_Limit: Highest July-Aug (>9500), lowest March-April/Sept-Oct (7500-8000); increases mid-year.
- Total_Trans_Amt: Peaks July (~4800), lowest April/Oct (4100-4200), reflecting mid-year spending increase.
- Total_Trans_Vol: Mirrors amount: peaks July (~67), lowest March-April/Sept-Oct (~62.5-63).
- Interest_Earned: Highest July-Aug (~875-880), lowest March-April/Oct-Nov (700-750), spiking with mid-year activity.
Insights from Customer Dataset:
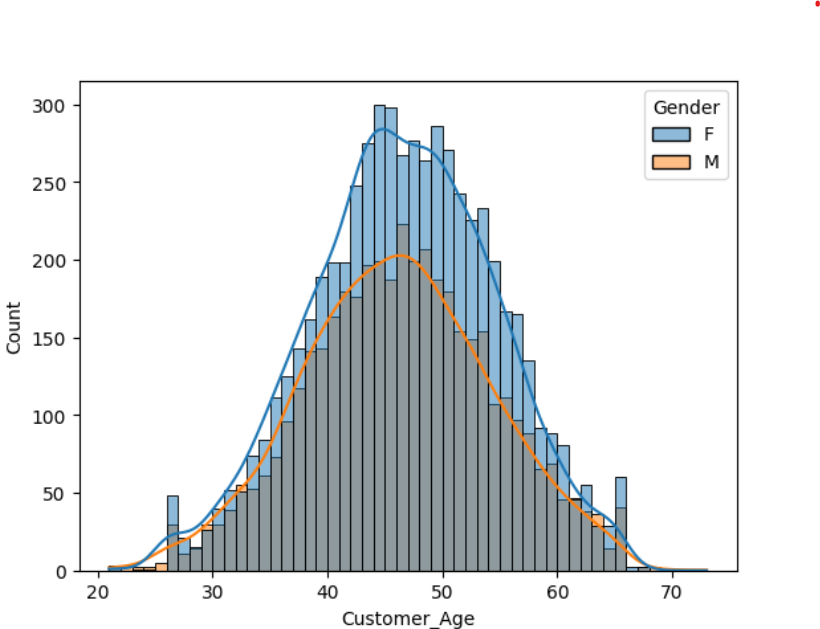
- Age Distribution is Bell-Shaped: centered around ages 45–50.
- Females (F) have a slightly higher peak than males in the 45–50 age range.
- Very few customers are below 30 or above 65
- Very few customers are below 30 or above 65, indicating the bank’s primary customer base is likely employed, middle-aged adults
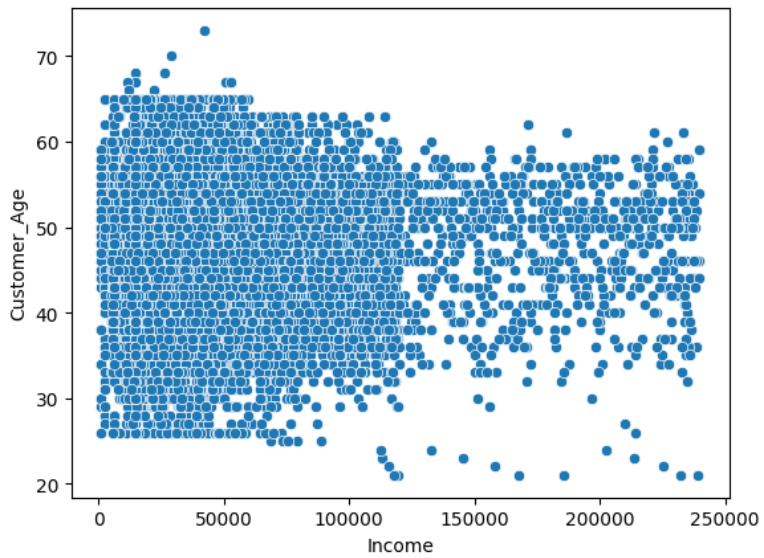
- A large number of customers earn below 120,000, forming a dense vertical block.
- Few customers appear with very high income (>200K), but they are rare.
- Income appears evenly spread across age groups up to 60
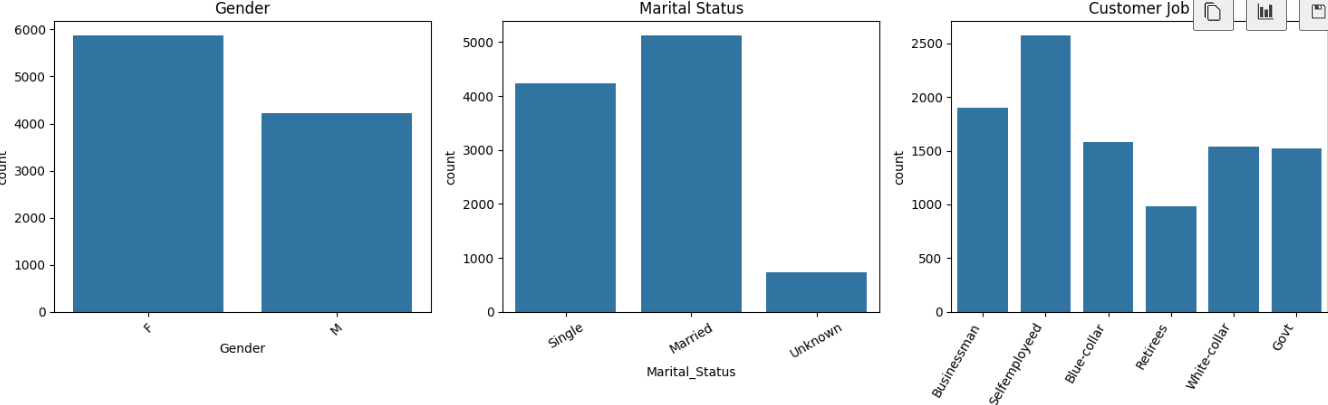
- Most customers are female, married, and self-employed.
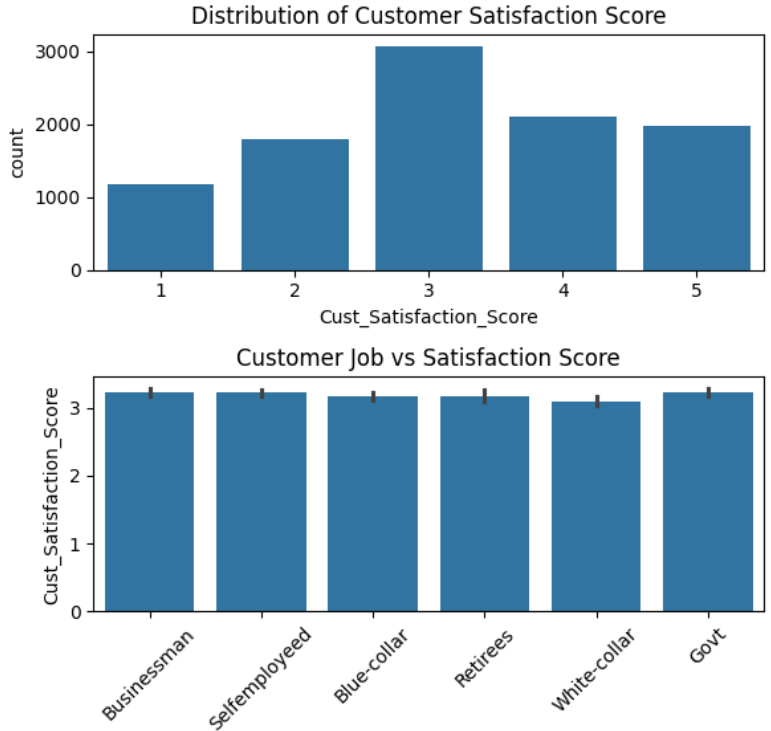
- Majority of customers rated satisfaction as 3; Satisfaction scores 4 and 5 are reasonably common
- Distribution is almost symmetrical, but slightly skewed towards higher satisfaction.
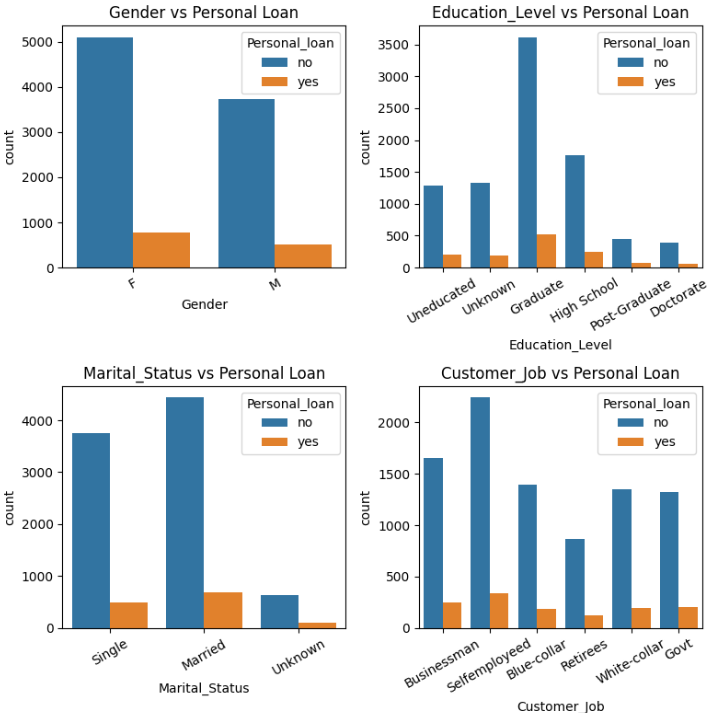
- Females take slightly more personal loans than males.
- Graduates take the most loans; postgraduates and doctorates the least.
- Married people take more loans than singles.
- Businessmen and self-employed take the most loans; retirees the least.
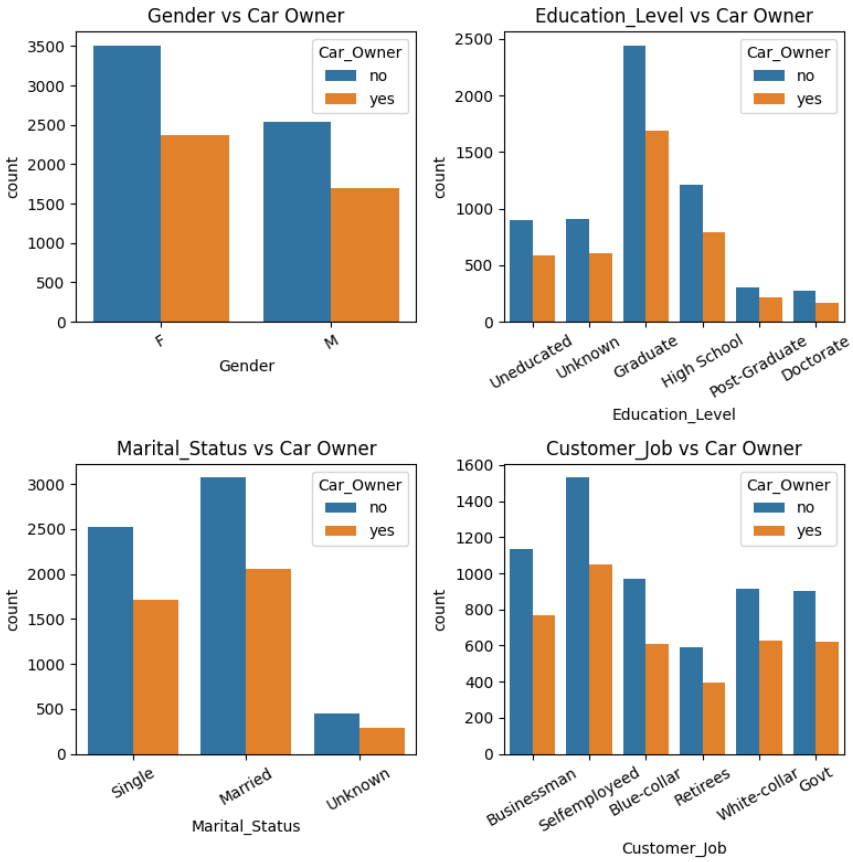
- More females own cars than males.
- Graduates are the most likely to own cars.
- Married individuals are more likely to own cars than singles.
- Self-employed and businessmen show higher car ownership; blue-collar and retirees the least.
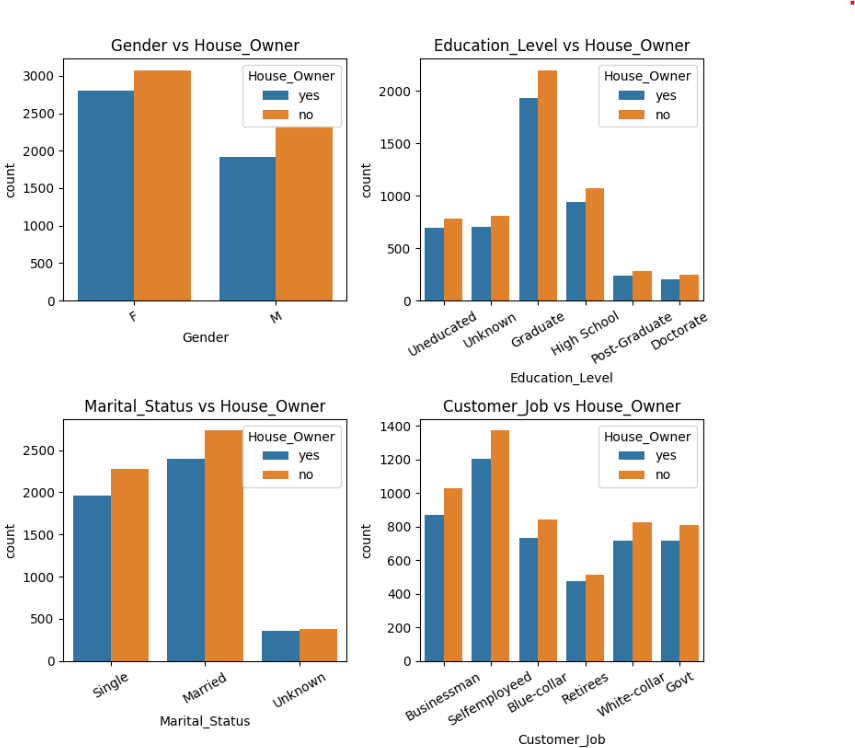
- More females than males own houses.
- Graduates are the most likely to own houses.
- Married people show slightly higher house ownership.
- Self-employed and businessmen own more houses compared to other job types.
Conclusion (with Numerical Insights):
Seasonal Trends:
- Highest spend & volume in July (Amt: ~$4,800; Vol: ~67), lowest in March–April/Oct.
- Credit limit peaks mid-year ($9.5k), lowest in March–April (~$7.5k–$8k).
- Interest earned & acquisition costs also peak mid-year, drop early and late in year.
Customer Demographics:
- Age centered at 45–50; few <30 or >65 — suggesting a working middle-aged base.
- Most customers earn < $120k; high-income (> $200k) are rare.
- Majority are female, married, and self-employed.
Loans, Car & House Ownership:
- Loans: More common among females, graduates, and self-employed.
- Car ownership: Higher in females, graduates, and self-employed.
- House ownership: More common in females, married, and business/self-employed.
Satisfaction Ratings:
- Most rate 3 (neutral); ratings 4–5 are also common, showing mild positive skew.
Categorical Trends:
- Card type: ~9,000 hold Blue cards; Gold cards <50.
- Method: Swipe dominates (~7,000 transactions).
- Top spend areas: Bills (~3,000), Entertainment (~2,000), Fuel (~1,700).