
Pharma Sales Performance Report
Github
Outcome :
Total Sales and Product Performance Overview
City-Level Sales and Price Analysis - Germany & Poland
Sales Manager and Contribution Analysis
Background:
Imagine needing to truly understand what’s happening with pharmaceutical sales. That’s precisely what this project sets out to do. We’ve built an intuitive dashboard, powered by Power BI, that takes all our raw sales figures and turns them into clear, actionable insights. Think of it as a detailed map that shows us exactly where our products are selling, through which channels, and how our sales teams are performing, all based on a robust and well-organized data foundation. It’s about bringing clarity to complex sales data so we can make smarter decisions, faster.
Objective: The primary objective of this project is to develop an interactive Power BI report that empowers sales managers, marketing teams, and executives to
- Monitor overall sales performance and identify deviations from targets.
- Analyze sales trends by various dimensions (e.g., product, channel, region, time).
- Evaluate the performance of sales representatives and distributors.
- Understand customer purchasing behavior and identify key customer segments
- Support strategic planning for product launches, marketing campaigns, and sales force allocation
Tools & Technologies Used:
- Power BI
Insights:
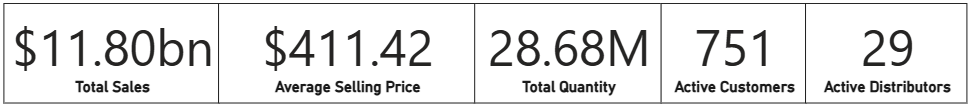
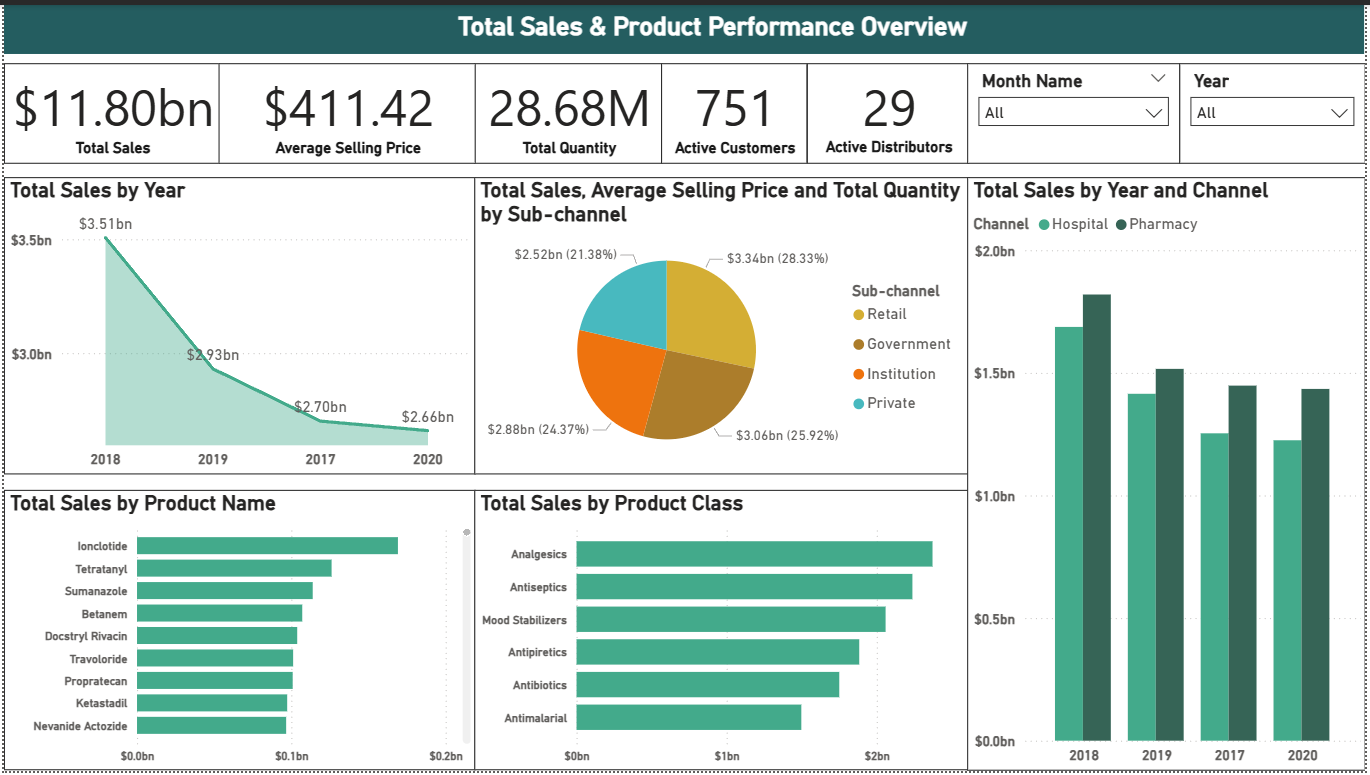
- Data reveals a high-revenue, high-volume business $11.80bn sales, 28.68M Units
- Concentrated customer (751) and distributor (29) base
- High average selling price ($411.42)
- Filter by Month Name and Year
- Total Sales by Year:
2018: $3.51 billion 2019: $2.93 billion 2017: $2.70 billion 2020: $2.66 billion Sales show a consistent decline from 2018 ($3.51bn) to 2020 ($2.66bn).
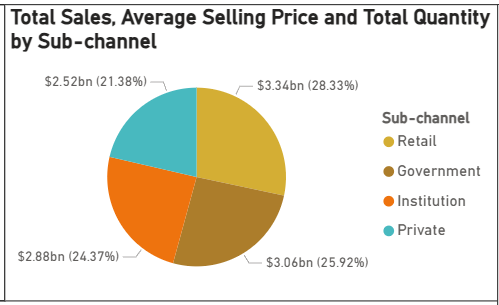
- Retail: Dominates with $3.34 billion, representing 28.33% of total sales.
- Government: Accounts for $3.06 billion, or 25.92% of total sales, showing a strong public sector presence.
- Institution: Contributes $2.88 billion, making up 24.37% of sales.
- Private: The smallest segment shown, with $2.52 billion, or 21.38% of total sales.
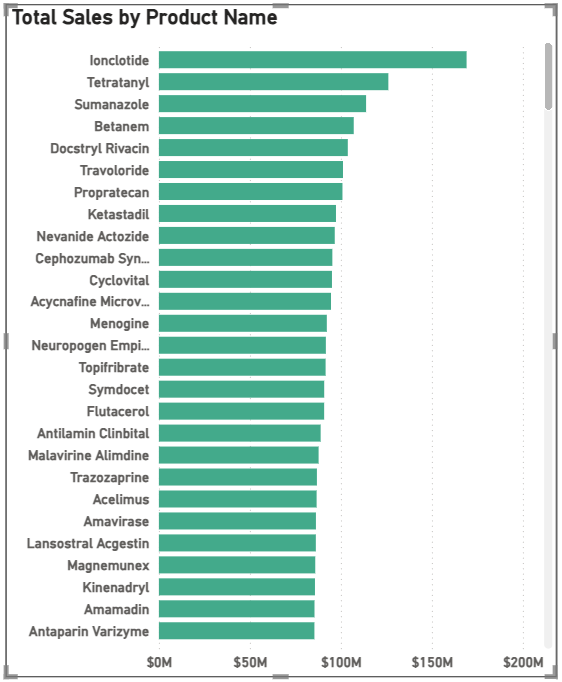
- Ionclotide leads with over $150M in sales, followed by Tetratanyl (near $150M) and Sumanazole (around $125M). Many others also show strong performance, generally between $75M-$100M.
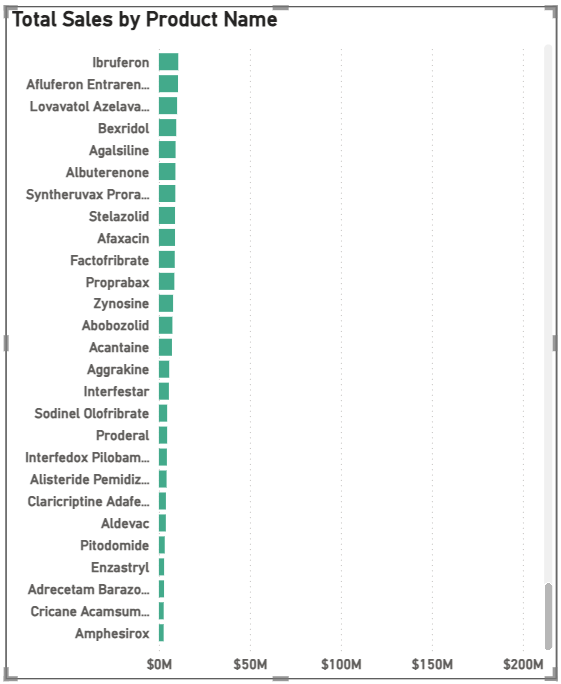
- A separate group of products, including Ibruferon and Amphesirox, contribute significantly less, mostly below $25M each.
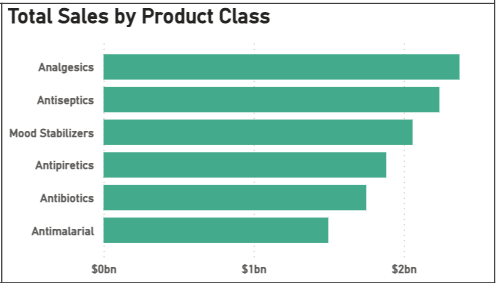
- Above $2 Billion: Analgesics, Antiseptics
- Between $1.5 Billion and $2 Billion: Mood Stabilizers, Antipyretics
- Between $1 Billion and $1.5 Billion: Antibiotics,
- Below $1 Billion: Antimalarial
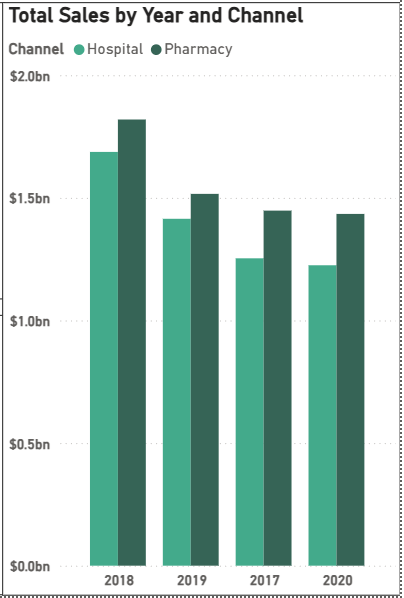
- Overall Trend: Both Hospital and Pharmacy channels show a general decreasing trend in sales from 2018 to 2020.
- From 2017 to 2019, both Hospital and Pharmacy channels experienced a sales peak in 2018, with Pharmacy consistently generating higher total sales.
- 2018: Hospital: Approximately $1.7 billion; Pharmacy: Approximately $1.85 billion (highest sales for both channels)
- 2020: Hospital: Approximately $1.2 billion (lowest sales for Hospital); Pharmacy: Approximately $1.4 billion (lowest sales for Pharmacy)
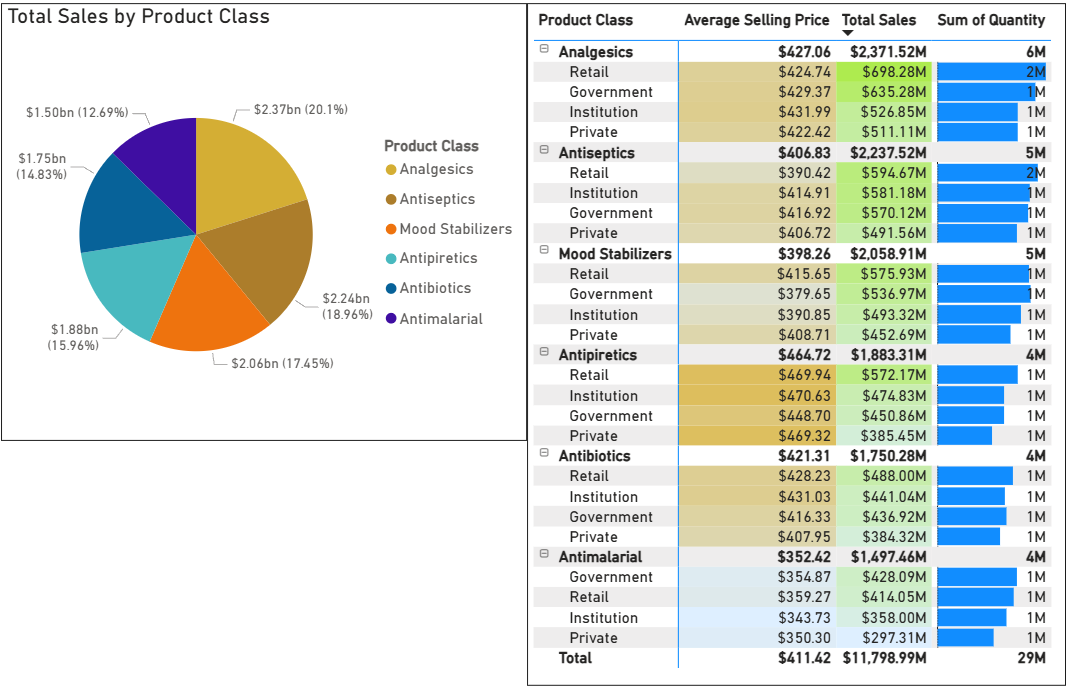
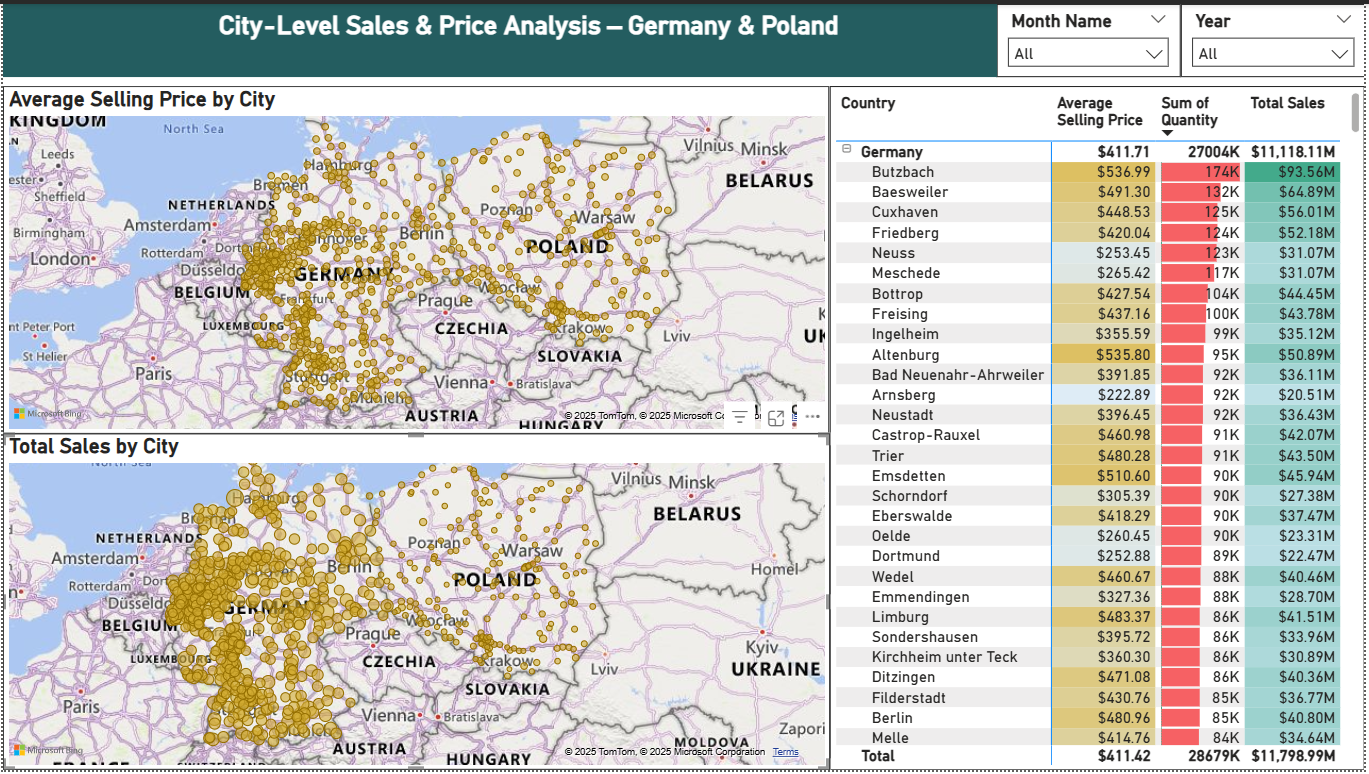
- Total Sales: $11.798 billion from 29 million units sold.
- Sales Dominance: Analgesics ($2.37B, 20.1%) and Antiseptics ($2.37B, 18.96%) are the top two product classes by sales, collectively accounting for $4.74B (39.06%) of total sales.
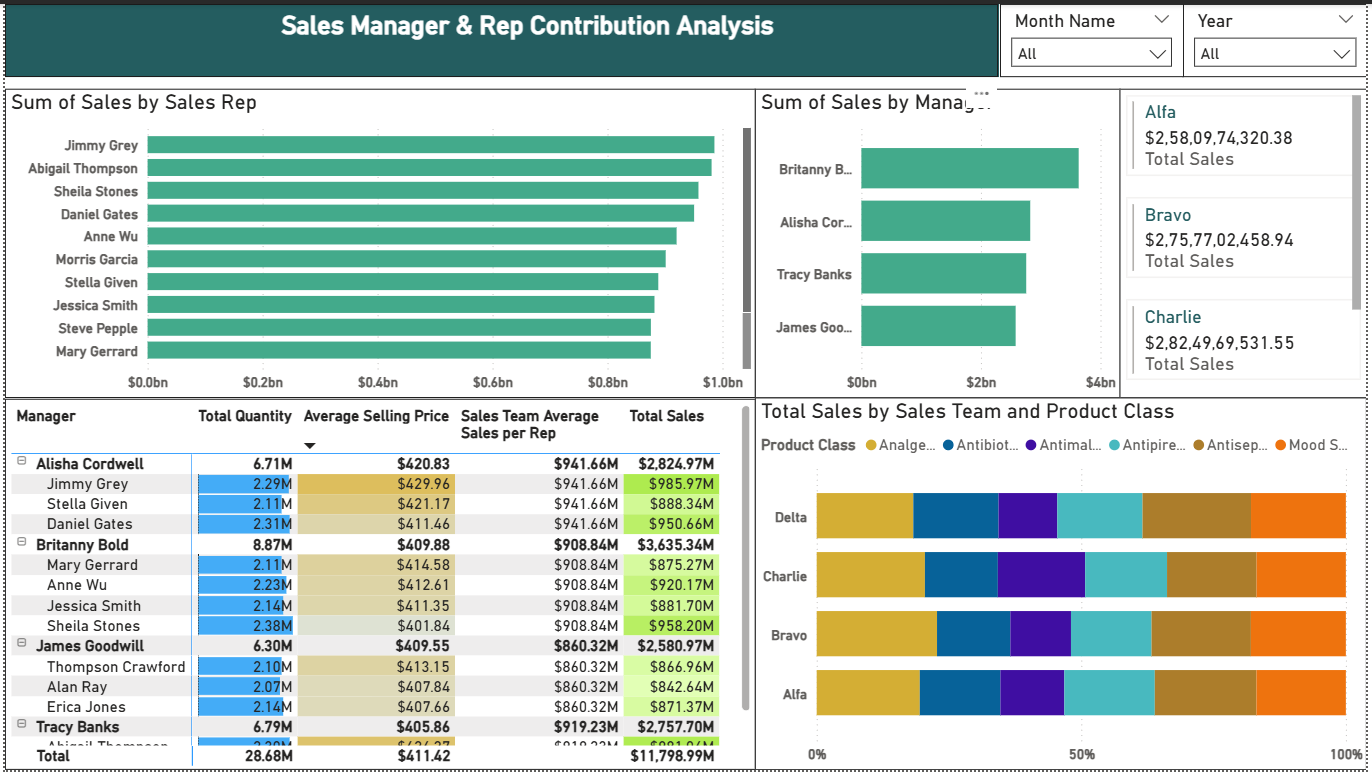
Insights from the matrix table:
- Top Performers: Analgesics & Antiseptics drive ~40% of sales ($4.74B); maintain focus.
- High-Value Leverage: Antipiretics’ high ASP ($464.72) makes it a prime candidate for volume growth.
- Targeted Growth: Consider boosting Government sales for Antimalarial (highest ASP in class, $354.87).
- High-Value Leverage: Antipiretics’ high ASP ($464.72) makes it a prime candidate for volume growth.
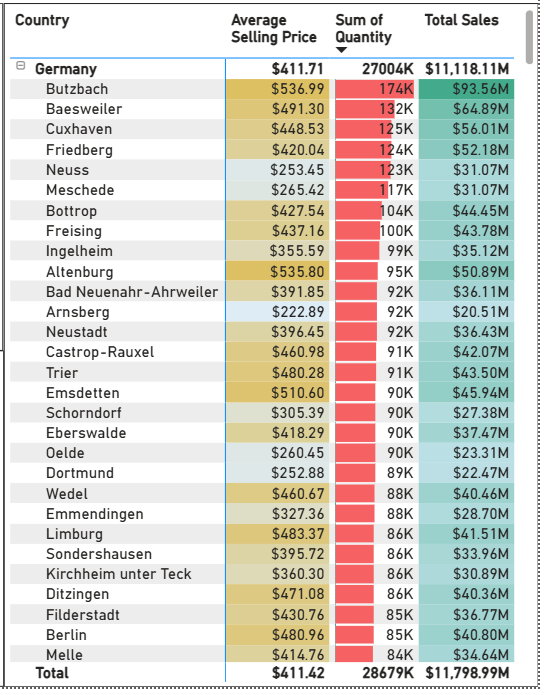
- Butzbach dominates due to its exceptional combination of high prices and high quantity.
- Cities like Dortmund and Arnsberg need attention – low prices and volumes reduce their contribution.
- Several cities (e.g., Friedberg, Bottrop, Freising) show sustainable, mid-range performance — essential for long-term stability.
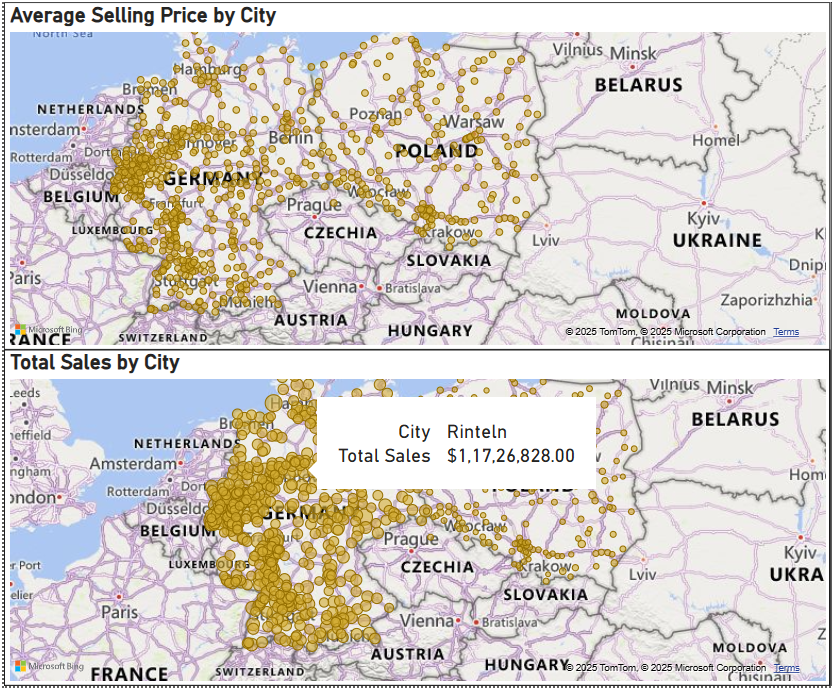
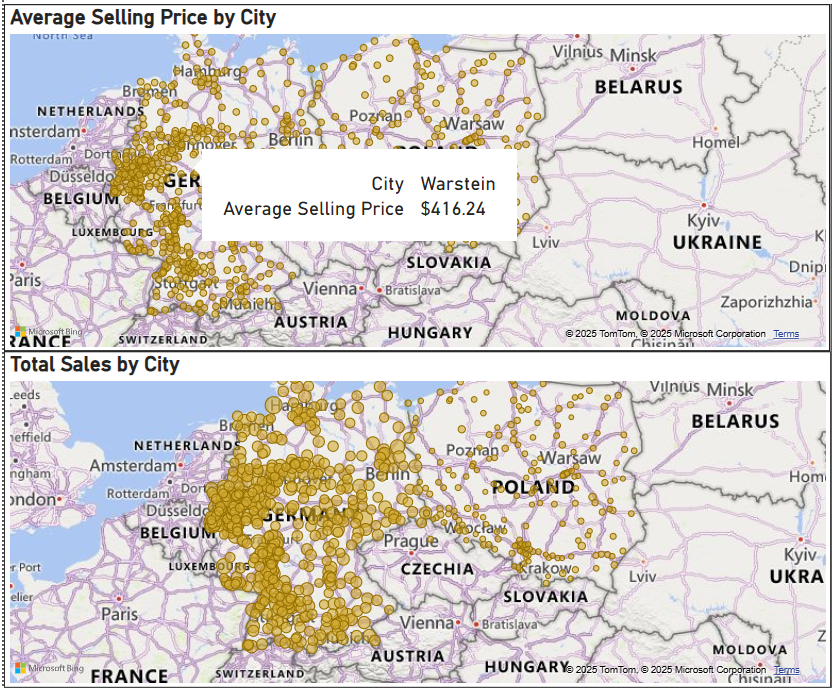
- Regional Insights: Instantly spot high-performing cities and clusters (like western Germany) for both sales and pricing.
- Targeted Strategy: Identify underperforming (e.g., eastern regions) for market expansion or pricing optimization
- City-Level Drilldowns: Hovering over cities like Warstein gives precise average price data — useful for localized decision-making.
- Brittany Bold leads with $3.63B in total sales — the highest among all managers.
- Jimmy Grey tops the individual chart with $985.97M in total sales under Alisha Cordwell.
- Brittany Bold’s team moved 8.87M units, leading in volume, despite slightly lower average prices.
- Jimmy Grey with $429.96 per unit – above the team and national average.
- Stella Given, Daniel Gates, and Jimmy Grey all have nearly equal team average sales (~$941M), indicating strong team balance and leadership under Alisha.
- James Goodwill’s team, despite decent volume (6.30M units), lags in total revenue at $2.58B due to a lower average price ($409.55).
- Close Competition Between Teams: Charlie: $2.82B, Alfa; $2.58B; Bravo: $2.75B